For Power BI developers and analysts
Talk to your Power BI report. Claude reads the model, writes the measures and builds the dashboard.
The problem: understanding someone else's model, debugging DAX and writing the same measures again takes hours, and copying tables into a chat loses the context. The fix: connect Claude to the report open in Power BI Desktop. Ask in plain English; Claude looks at your real tables, relationships and numbers, then answers, edits the measure, or builds a whole dashboard page for you.
What it looks like
An example chat in Claude Desktop with a sales report open in Power BI Desktop. The grey lines are the tools Claude used.
Accessories grew fastest: ₹19.8 L this year against ₹14.3 L last year (+38%). Bikes grew 12% and Clothing 4%.
| Category | This year | Last year | Growth |
|---|---|---|---|
| Accessories | 19,75,000 | 14,31,000 | +38% |
| Bikes | 1,25,00,000 | 1,11,60,000 | +12% |
| Clothing | 48,20,000 | 46,35,000 | +4% |
Added [Sales YoY %] to the Sales table, formatted as a percentage:
Sales YoY % =
VAR LastYear = CALCULATE ( [Total Sales], SAMEPERIODLASTYEAR ( 'Date'[Date] ) )
RETURN DIVIDE ( [Total Sales] - LastYear, LastYear )
It's in your model now. Save the report in Power BI Desktop to keep it.
Illustration with sample numbers. Your answers come from your own model.
New · Dashboard builder
Ask for a dashboard. Claude builds the page.
Claude looks at your tables and measures, adds the measures the page needs, then lays out the cards, slicers, charts and tables on a new page of your report. You open it in Power BI Desktop and it's there, ready to tweak.
I added four measures. Press Ctrl+S in Power BI Desktop so they're saved, then tell me to carry on.
Done. The Sales overview page has Total Sales, Orders and Average order cards, Year and Category slicers, sales by month against last year, a category donut, top regions and a category detail table.
Close Power BI Desktop, choose Don't save, and open Sales.pbip again to see it.
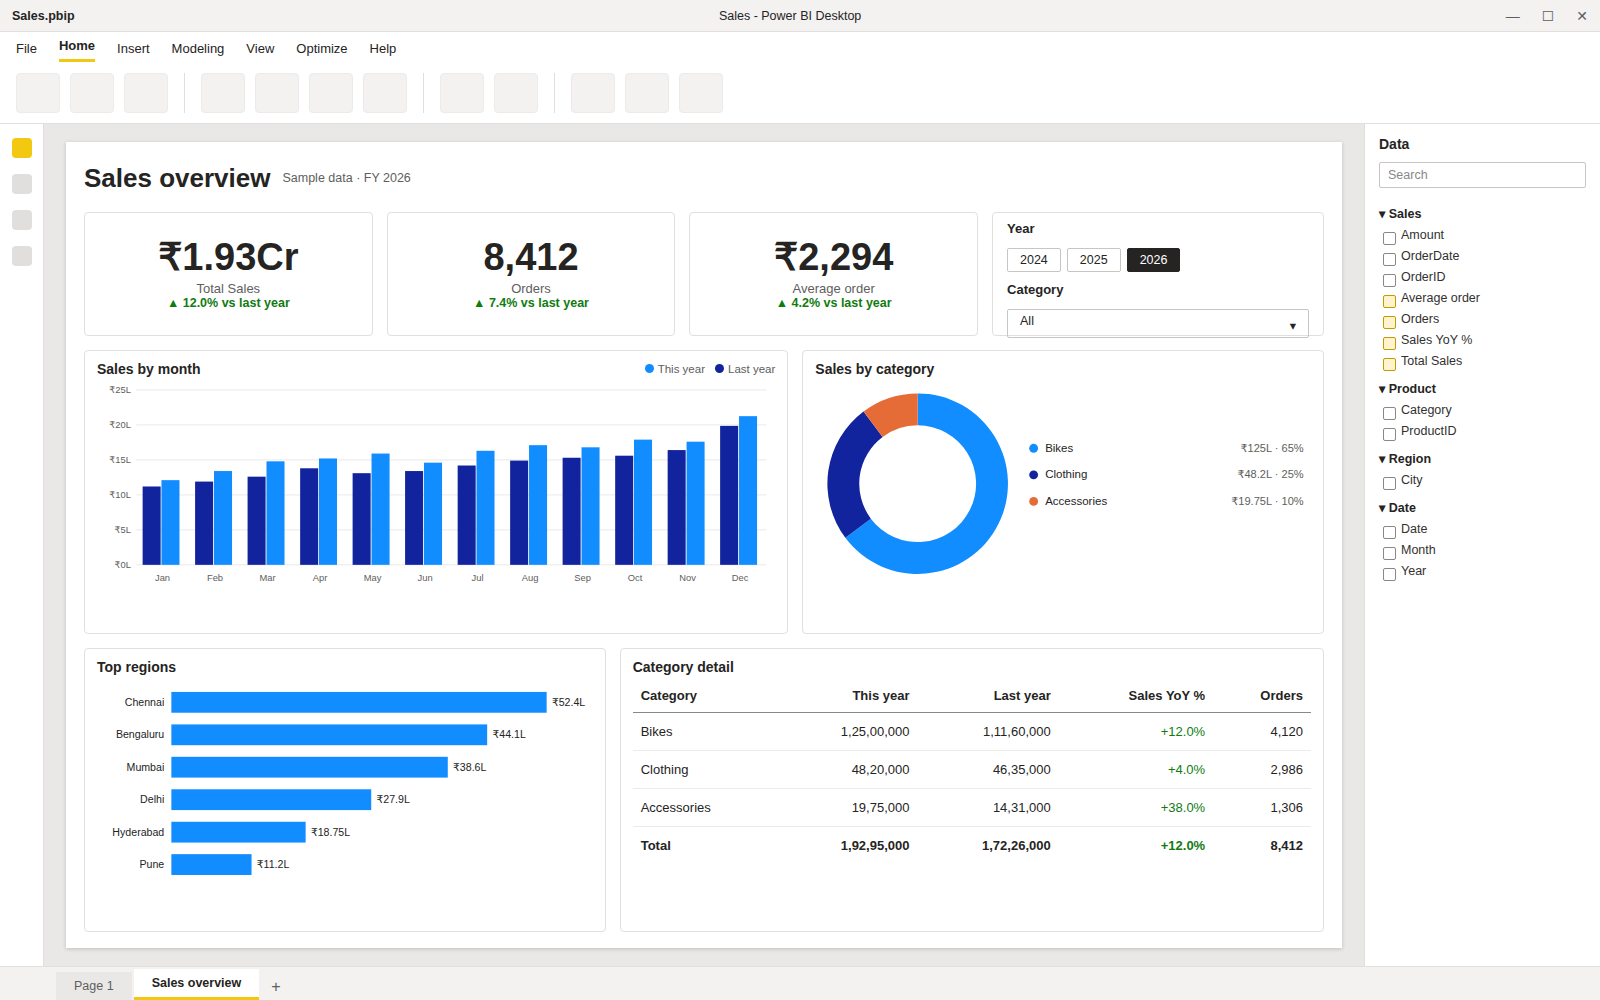
Illustration of the kind of page Claude builds, made with sample data. Your page uses your own fields and numbers, with Power BI's default look, which you can restyle.
10 sample dashboards
One sentence each. Ten very different dashboards.
Sales, finance, HR, marketing, e-commerce, supply chain, hospital, support, education and projects. Each was planned from one prompt, using only the visuals and themes the dashboard builder makes: cards, gauges, combo, waterfall, funnel, scatter, treemap, stacked area, donut, tables and more, in 8 ready themes.
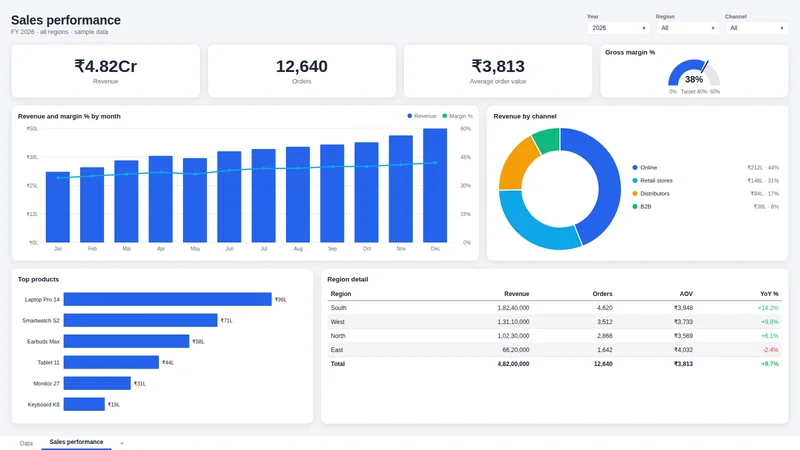
Build a sales performance page: revenue, orders, AOV, a margin % gauge against 40%, revenue with margin % by month, revenue by channel, top products and a region table.
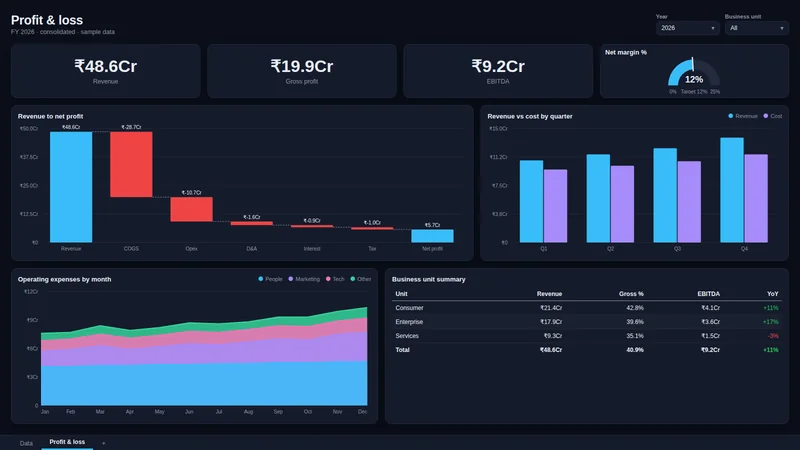
Make a P&L page with a waterfall from revenue to net profit, revenue vs cost by quarter, opex by month as a stacked area and a business unit summary. Use the midnight theme.
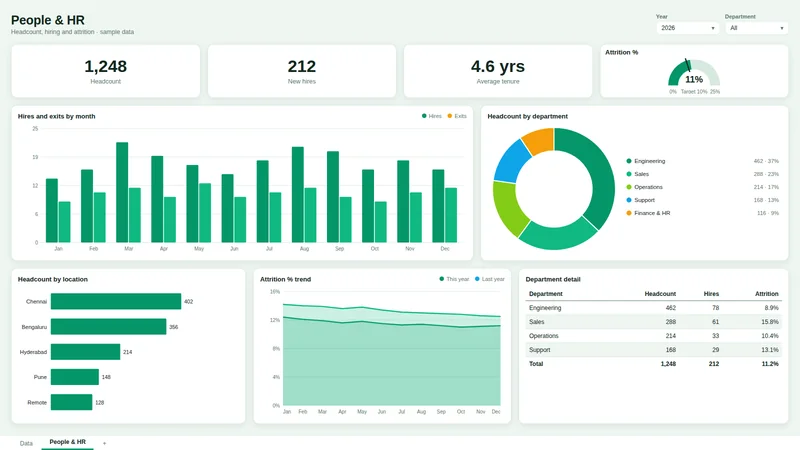
Create an HR dashboard: headcount, hires, tenure, an attrition gauge with a 10% target, hires vs exits by month, headcount by department and location.
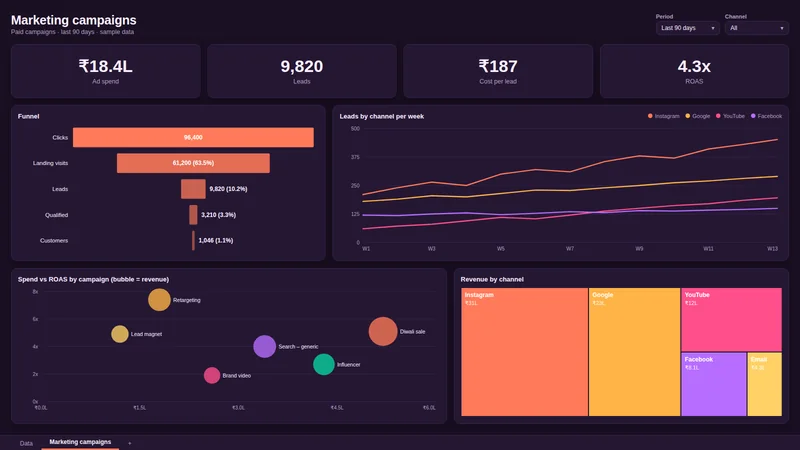
Build a campaign page with a lead funnel, leads by channel per week, a spend vs ROAS bubble chart by campaign and revenue by channel as a treemap. Sunset theme.
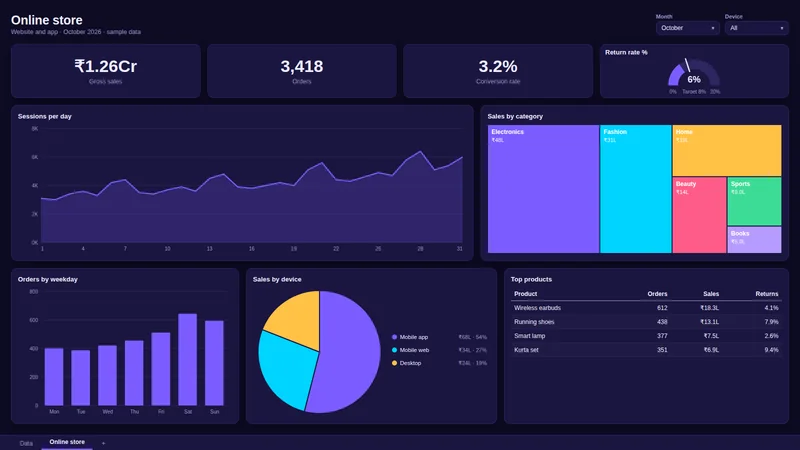
Online store dashboard for October: sales, orders, conversion rate, return rate gauge, sessions per day, sales by category treemap, orders by weekday and top products.
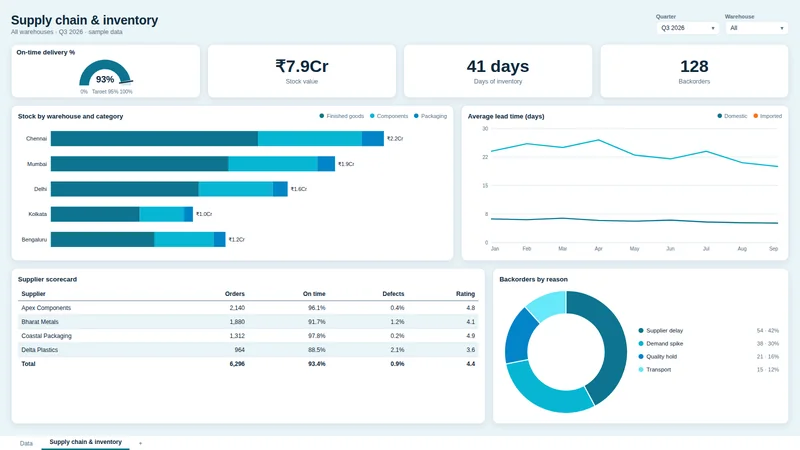
Supply chain page: on-time delivery gauge vs 95%, stock value, days of inventory, stock by warehouse stacked by category, lead time trend and a supplier scorecard.
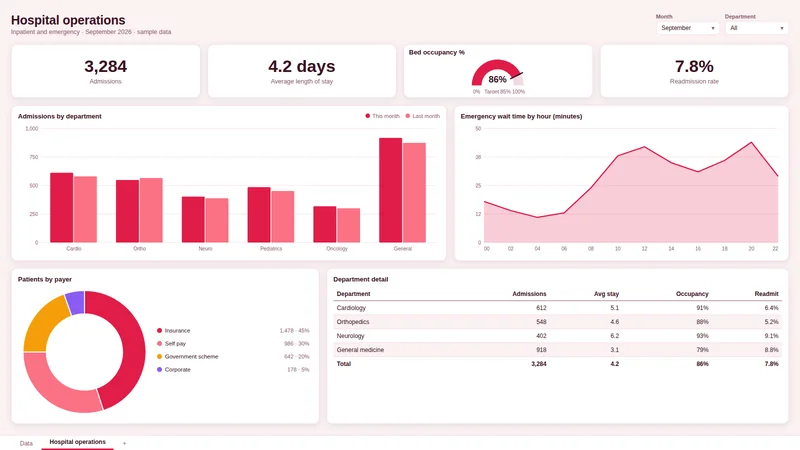
Hospital operations dashboard: admissions, length of stay, bed occupancy gauge, readmission rate, admissions by department, ER wait by hour, payer mix and a department table.
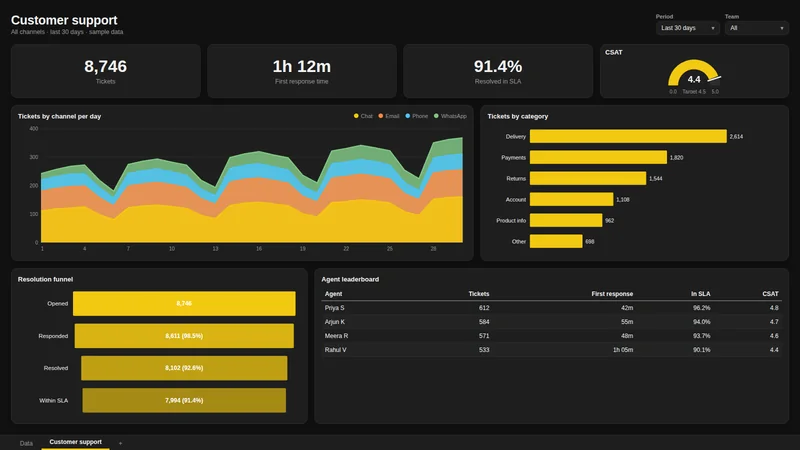
Support dashboard for the last 30 days: tickets, first response, SLA %, CSAT gauge, tickets by channel per day, by category, a resolution funnel and an agent leaderboard.
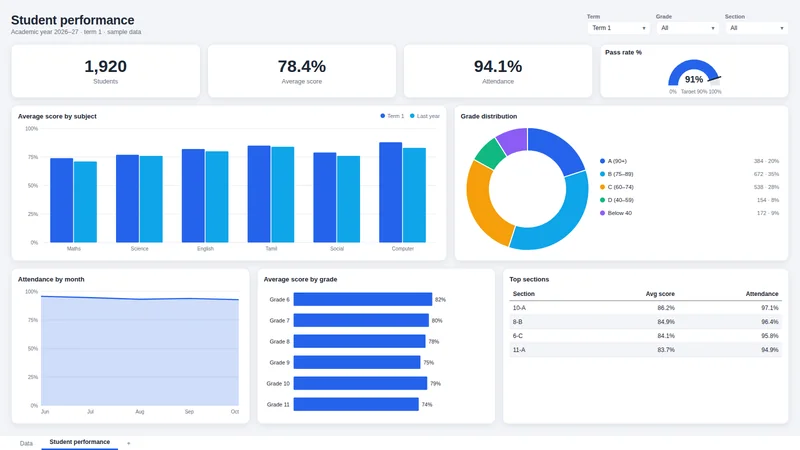
Student performance for term 1: students, average score, attendance, pass rate gauge, score by subject vs last year, grade distribution, attendance trend and top sections.
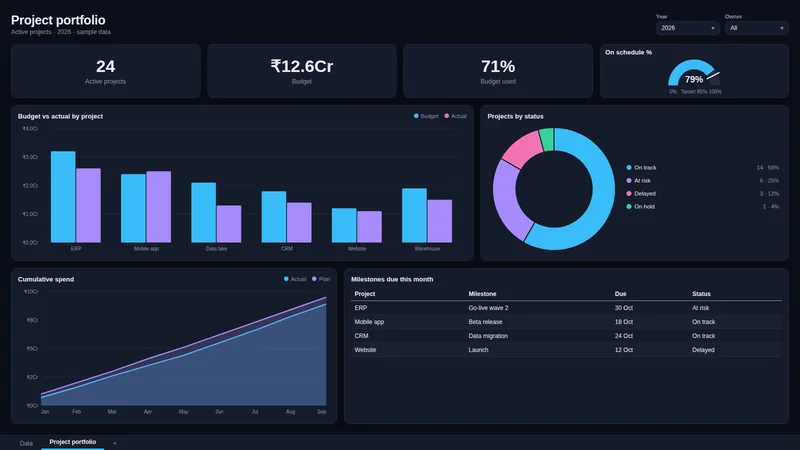
Project portfolio page: active projects, budget, budget used, on-schedule gauge, budget vs actual by project, status donut, cumulative spend vs plan and milestones due.
Illustrations made with sample data in the kit's built-in themes. Your dashboards use your own fields and numbers; Power BI draws the final visuals. Power BI has no built-in 3D charts, so the 3D here is only how this page shows the samples.
The old way vs. asking Claude
😩 Before
- Click through every table to understand a model
- Copy DAX into a chat, lose the context
- Guess why a total is wrong
- Write the same time-intelligence measures again
- Drag every card and chart onto the page yourself
- Document reports by hand
⚡ Now
- "Explain this model" and get the full picture
- Claude sees your real tables and relationships
- It runs DAX to test its own answer
- "Add YoY, MTD and running total measures"
- "Build me a sales dashboard" and the page appears
- "Document every page and visual"
What Claude can do in your report
🔎 Read the model
Tables, columns, data types, calculated column formulas, every measure with its DAX, and all relationships with cardinality and filter direction.
🧮 Run DAX
Any DAX query or a single expression. Claude uses it to answer questions with your numbers and to check its own measures before saving them.
✍️ Write measures
Create, update or delete measures straight in the open model. It tests the DAX first and never saves an expression with an error.
📊 Build dashboards
Claude designs a full report page from your model: KPI cards, gauges, slicers, column, bar, line, area, combo, waterfall, funnel, scatter, treemap and donut charts, tables and matrices, laid out neatly and titled.
🎨 8 designer themes
Corporate, Midnight, Ocean, Sunset, Emerald, Royal, Rose and Graphite: page background, rounded cards with shadows and matching chart colours, applied in one step.
📄 Read report pages
Pages, visuals and the fields each visual uses, from your .pbix or .pbip file. Great for documentation and finding unused measures.
🔀 Several reports
Finds every report open in Power BI Desktop and switches between them on request.
🩺 Built-in checker
One double-click tests Python, the libraries, the connection to Power BI and Claude's settings, and tells you exactly what to fix.
Ask it things like
| Understand | Explain this data model: what each table holds and how they connect. |
| Analyse | Top 5 products by margin last quarter, and what changed from the quarter before? |
| Build | Create MTD, QTD, YTD and YoY % measures for [Total Sales] in a "Time" folder. |
| Dashboard | Build a sales overview page in D:\Reports\Sales.pbip: KPI cards, sales by month, by category, top regions and a detail table. |
| Fix | My [Margin %] total is wrong. Find out why and fix it. |
| Review | Any relationships that could give wrong totals, like many-to-many or both-direction filters? |
| Document | Write documentation for every page and visual in D:\Reports\Sales.pbix. |
| Learn | Explain step by step how [Running Total] works, using numbers from my data. |
Set up in about 10 minutes
- Install Python 3.12 from python.org (one tick box, the guide shows it).
- Double-click Setup. It installs the libraries and adds the server to Claude Desktop, keeping any other servers you have.
- Restart Claude Desktop and open your .pbix in Power BI Desktop.
- Ask: "List the tables in my Power BI model."
[1/4] Using py -3.12
[2/4] Installing libraries...
[3/4] Connecting to Claude Desktop...
      Added 'powerbi' in ...\AppData\Roaming\Claude\claude_desktop_config.json
[4/4] Checking everything...
  [OK]  Python 3.12
  [OK]  Power BI client library found
  [OK]  Measure editing available
  [OK]  Open report(s) found on port 51234
  [OK]  Claude Desktop is set up
Why this kit
| Doing it yourself | Power BI MCP kit | |
|---|---|---|
| Setup | Create a venv, install packages, hand-edit Claude's JSON config | One double-click |
| Microsoft drivers | Often need the MSOLAP provider installed and registered | Uses the libraries already in Power BI Desktop |
| Measures | Usually read-only | Create, update and delete measures |
| Dashboards | You build every visual by hand | Claude builds whole pages of cards, charts and tables |
| Report pages | Rarely included | Pages, visuals and their fields (.pbix and .pbip) |
| When it breaks | Read logs and search forums | Checker tells you what to fix, plus a troubleshooting guide |
In the download
- 🧩Power BI MCP server with 14 tools for Claude, including the dashboard builder and 8 themes.
- ⚡One-click Setup, Check and Demo files for Windows.
- 📘PDF setup guide with example prompts and a troubleshooting table.
You need
Windows 10 or 11 · Power BI Desktop · Claude Desktop, signed in · Python 3.12 (free; the guide shows how to install it). Mac isn't supported, because Power BI Desktop only runs on Windows.
What buyers say
Who made this
I'm Aswathy, a software engineer and data analyst in Chennai. I teach Power BI, and I built this so Claude could work with my real models instead of pasted screenshots.
FAQ
Does it send my data anywhere?
The server runs on your computer and talks only to Power BI Desktop and Claude Desktop. When Claude uses a tool, the result (for example a table of numbers) becomes part of your Claude chat, like anything you paste into Claude. Nothing else is uploaded.
Will it change my report?
Only when you ask it to create, change or delete a measure, or to build a dashboard page. Changes show in Power BI Desktop immediately; save the report to keep them, or close without saving to undo. Claude can also be told to only read.
How does Claude build a dashboard?
Save your report once as a Power BI project (File > Save as > .pbip). Ask Claude for a dashboard; it checks your fields, adds any measures it needs, and writes a new page with the visuals into the project. Close Power BI Desktop without saving and open the .pbip again to see the page. You can then move, restyle or delete anything like a normal page.
Does it work with Power BI Service or a Mac?
No. It connects to Power BI Desktop on Windows, which is where the model engine runs on your computer.
Which Claude do I need?
The Claude Desktop app, signed in to your Claude account. Setup also connects Claude Code if you have it.
I have the Microsoft Store version of Power BI.
Reading the model and running DAX work. If measure editing shows as unavailable, install the normal Power BI Desktop from microsoft.com; the guide explains.
Do I need to know Python?
No. You install Python once with a tick box, and Setup does the rest.
Is it a subscription?
No. Pay once and use it on your own computers.
How do I get it after paying?
Right after payment you go to your download page, and the link is also emailed to you. Come back any time with your email and payment ID.
What if I get stuck?
Run the Check file; it tells you what to fix. If you're still stuck, email us with a screenshot and your payment ID.